
Cut your energy costs by up to 47%
Meet the energy management system saving businesses hundreds of thousands - Eniscope. See how much you could save with a free waste report.
Get a Free Energy Waste Report
Start with a free, no obligation waste report. Then unlock savings worth thousands with Eniscope, our world-leading energy management system.


See Eniscope in Action


Trusted by brands globally across all sectors

Industry Wastage
Did you know? Your industry could be wasting as much as 47% of its energy!
You might not be using that energy, but you’re still paying for it. With commercial energy bills rising, it adds up fast.
Eniscope reveals exactly where your energy is going so you can eradicate waste, cut your bills, and protect your profits. Best of all, there are no upfront costs!
Get a free, no obligation waste report and find out how much you could save! It takes 5 minutes of your time, but it could save you hundreds of thousands.
Average Energy Waste Per Sector
Monitoring & Management
Powered by AI, personalised by people
AI finds the opportunities at breakneck speed, analysing millions of bits of data every second.
Human energy experts curate the findings and show you how to unlock savings. Fast.
With Eniscope's additional IoT sensors, you can manage assets remotely, automate scheduling and flag energy spikes.
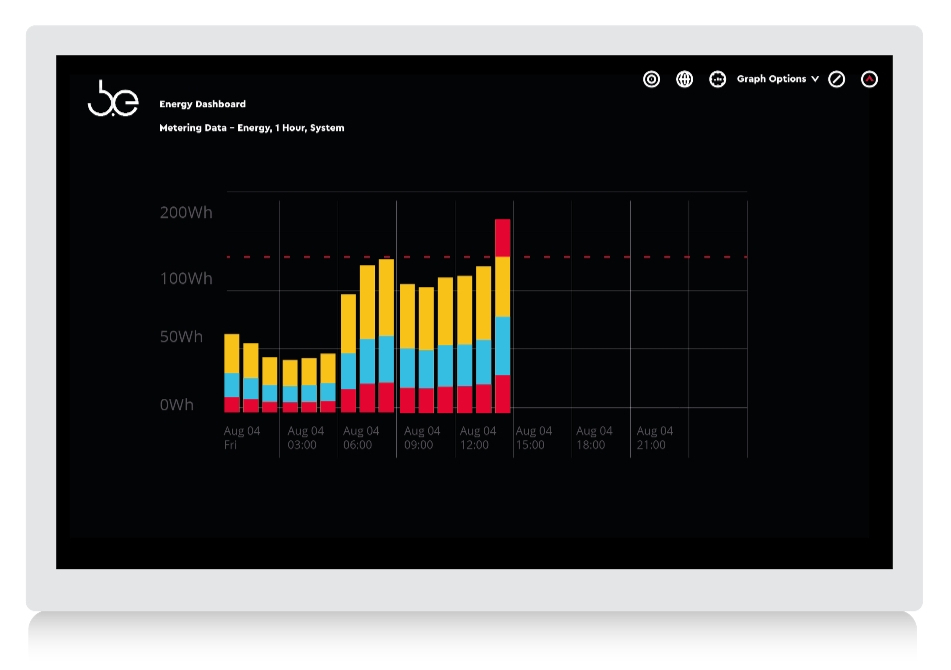
Energy Dashboard

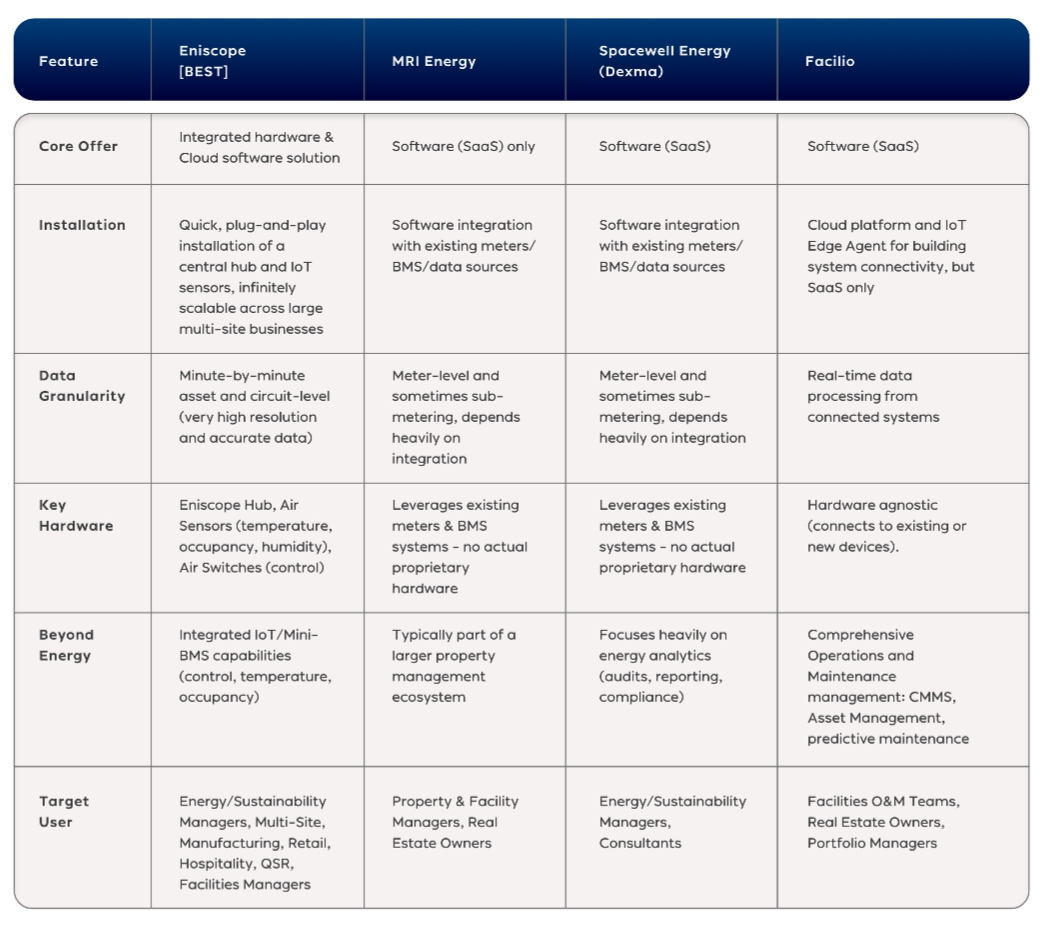
How We Compare
The most comprehensive energy management system yet.
We’ve spent 10+ years developing Eniscope Air Suite, using research, data, and expertise in energy efficiency to create the world’s most complete energy management system.
Fast to install. Powerful in performance. Eniscope brings unmatched visibility and control for speedy, high impact savings.
Comparison Table

Meet Eniscope Air, the game-changer in energy efficiency.
With Eniscope’s wireless Air sensors, unlock more smart functionality, Cloud control and energy savings. The future is Air.

Energy Management
FAQs
Once you fill in the form, a member of our team will give you a call to ask a few questions about your business. This will help us to create a waste report which will estimate areas of waste and identify potential savings for your business. It only takes a few minutes of your time, but the findings could save your business thousands - or even hundreds of thousands. It's completely free. no strings attached, and there's no obligation to work with us afterwards.
The system is specifically designed for minimal disruption to operations, with a “plug-and-play” design. No power shutdown is needed.
Eniscope reveals energy consumption in real-time, down to the asset level. That means you can see exactly where your energy is used, and wasted, across the facility. Once you have the visibility, you can stop equipment being left on, or turned on too early, optimise it for efficient running and introduce new retrofit energy saving technologies with a way to verify how effective they are. Alerts, context monitoring (e.g. occupancy), IoT control and extensive reporting are all built in as standard.
Unlike most energy monitoring providers, we use the data as the foundation of the project - not the whole exercise. AI tools help extract value from the data and your VEM (Virtual Energy Management) team interpret the findings and advise you on actions you can take. It’s the combination of data and humans that won us the Use of Data and Analytics Award at the National Sustainability Awards, and all of our projects are backed by at least a 100% cost guarantee.
Eniscope’s hardware collects data on electricity and gas use. Eniscope Analytics then transforms this into easy-to-understand graphic displays and dashboards, making "invisible" energy use visible.
Yes! Eniscope is designed with robust integration capabilities to work seamlessly with existing BMS. The suite of Eniscope Air products also provides a flexible, scaled-down BMS functionality, which can either complement or act as a lightweight alternative to a full, complex BMS.
Yes, we provide training for the Eniscope Analytics platform, covering how to navigate dashboards across sites or meters, interpreting data and graphs to identify key patterns, setting up automated reports and comparing usage.
We also teach you how to translate data into actionable savings, including guidance on using the data to quickly identify the top opportunities for immediate, low-cost savings, and how to use the system's data to measure and verify the savings achieved after implementing changes.
Eniscope directly addresses the largest source of emissions for many businesses: Scope 2 emissions (indirect emissions from purchased electricity).
It helps you meet your carbon goals by instantly displaying energy consumption in terms of carbon dioxide equivalent, providing audit-ready data for compliance with various environmental, social, and governance reporting frameworks. It also cuts energy waste, identifies equipment that requires maintenance or upgrading, and can set up public displays showcasing live consumption and carbon output to encourage energy-conscious behaviour.
Yes, the Eniscope system is highly scalable and is specifically designed to work across multiple sites, buildings, or entire portfolios. It’s popular with multi-site quick service restaurants, retail chains, hotel groups, manufacturing facilities, educational campuses, and more.
All data from every Eniscope hub is securely aggregated into a single, centralised cloud platform, so data can be accessed from any web browser or mobile device. You can drill down from portfolio view to regional groupings, individual buildings, and even specific assets within a single facility!
Eniscope is specified to a high standard, with better than 1% accuracy for voltage and current inputs. This high level of accuracy ensures that the data recorded is reliable for financial and operational decision-making, reporting on ROI, benchmarking utility bills, and targeting energy waste.
Eniscope delivers monitoring data that is typically more accurate and more granular (minute-by-minute) than standard utility billing meters, making it a reliable foundation for your energy management strategy.
How much could you save?
Get a free, no obligation waste report and find out. It takes you 5 minutes, it could save you hundreds of thousands.

Click the thumbnail for an enlarged version of what an energy waste report looks like